Converting Excel Charts To TIFF Images
Having trouble making sure your graphics and images are just right for your publication? Academic publications including medical journals and web publications will often require high-resolution graphics and images. When submitting an article that contains excel document charts for publications, these charts are often required to be submitted as separate TIFF images, and often need to meet strict requirements regarding the resolution, width and height of the resulting TIFF image.
The tutorial below will demonstrate how to easily convert excel document charts to TIFF images to the exact specifications required.
How To Convert Excel to TIFF
Manipulating an excel chart can be difficult because Microsoft Excel will automatically scale charts to fit to the page when it prints them, preventing you from creating a TIFF image at the size you require from within Excel.
This is easily fixed by first creating the chart in Excel, and then copying that chart into Microsoft Word, PowerPoint or Publisher. By copying the chart into Word and then using TIFF Image Printer‘s trimming options, we can easily create the exact sized TIFF image we want.
Step-by-Step Document Conversion Process
1. Double-click the TIFF Image Printer icon to launch the dashboard and select Edit & Create Profiles.
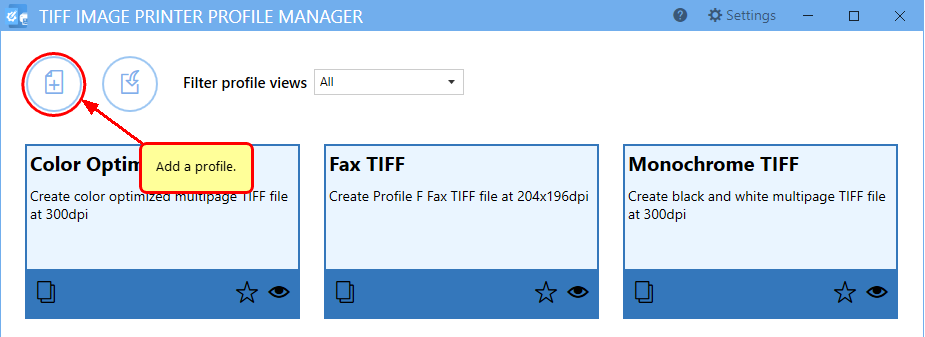
2. Select Add Profile and enter a name and description.
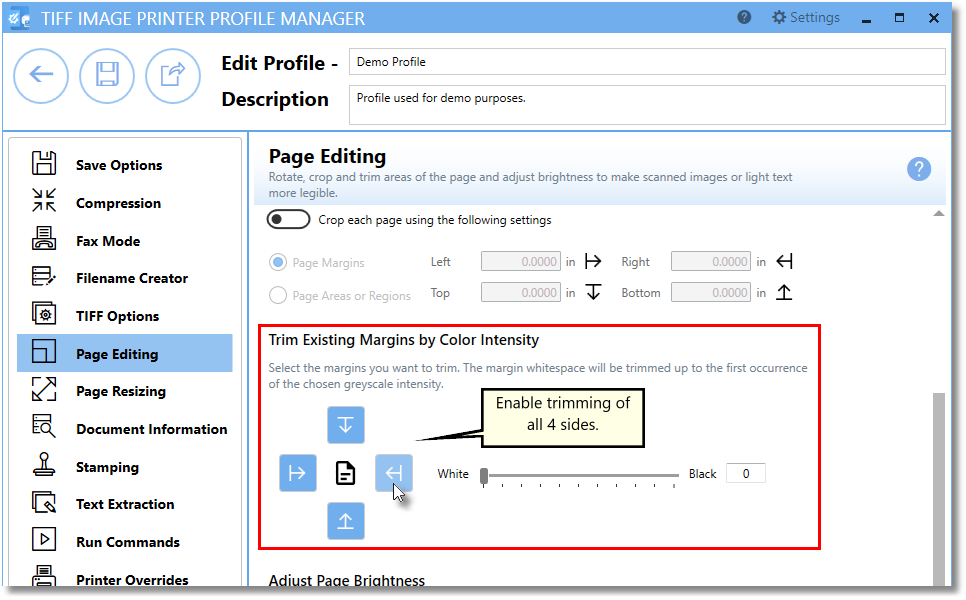
3. Select the Page Editing tab, and scroll down to Trim Existing Margins by Color Intensity.
4. Select all 4 arrows in order to trim the white space from the all around your Excel chart.
5. Click Save and Back, and then close the Profile Manager.
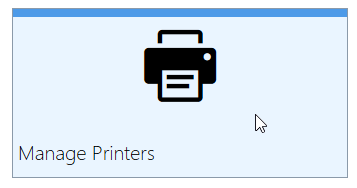
6. Select Manage Printers.
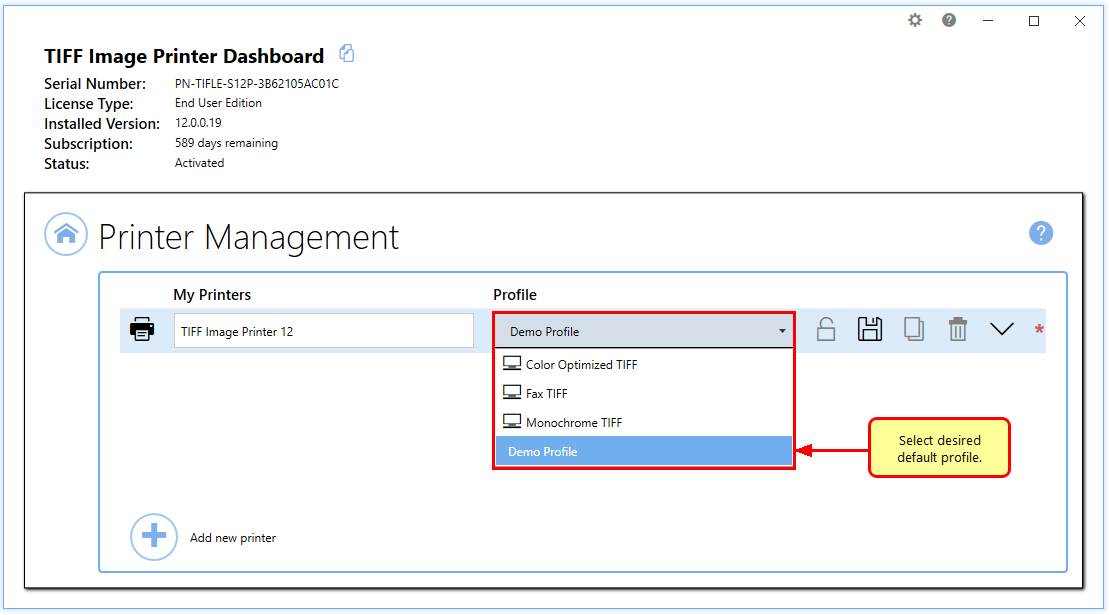
7. Choose your profile from the list to make it the default profile for TIFF Image Printer.
8. Now open the Excel spreadsheet that contains your chart. Make sure the chart is an embedded or floating chart, and not on its own sheet.
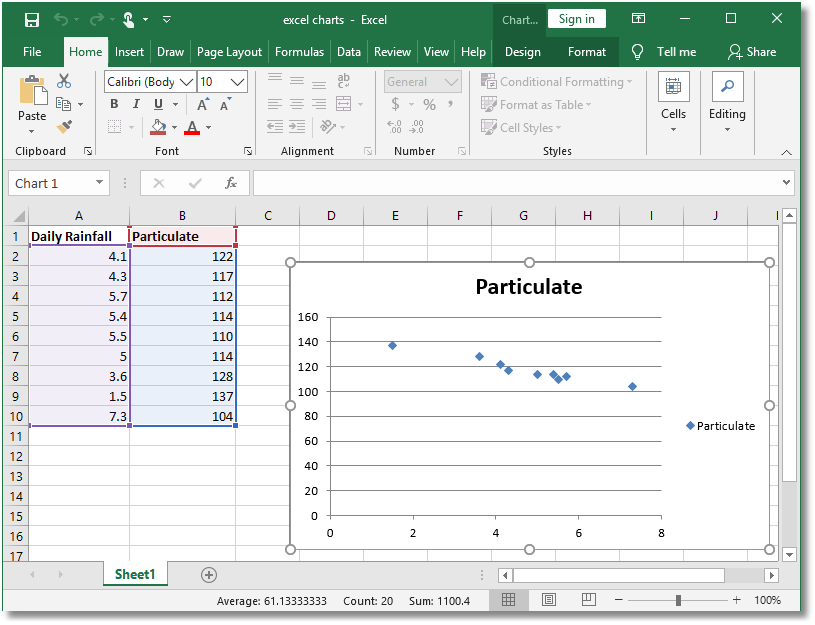
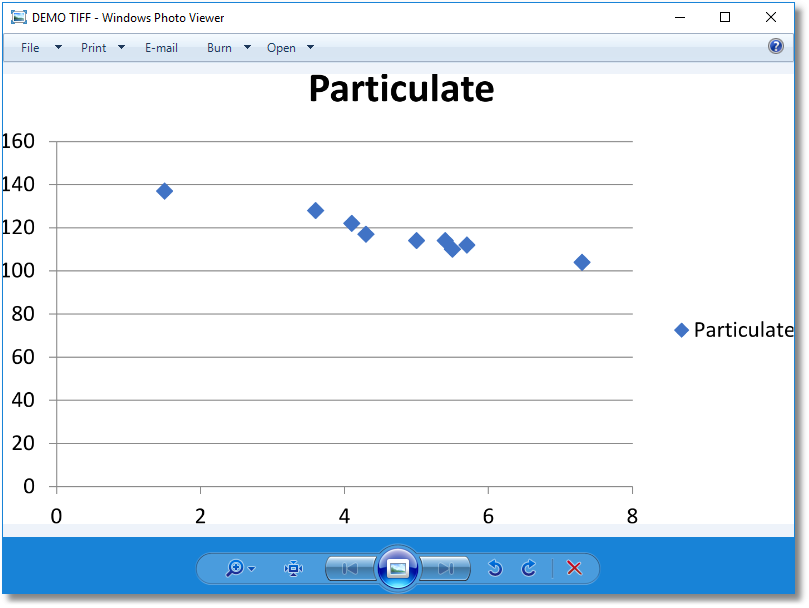
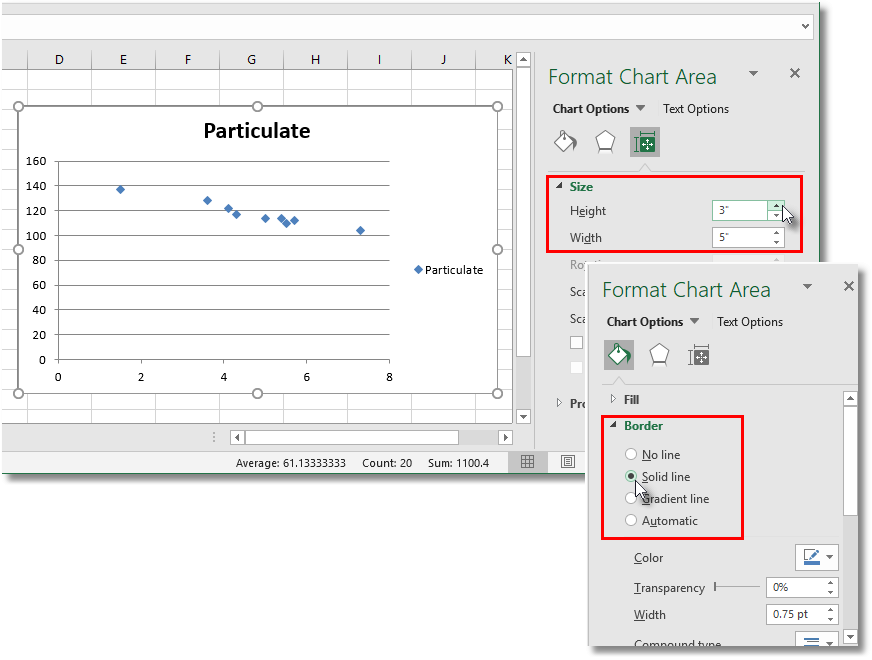
9. Right-click the chart and select Format Chart Area to set the size of your chart. Our sample chart is set to a height of 3 inches and a width of 5 inches and has a border. This border is required to tell TIFF Image Printer where to stop trimming.
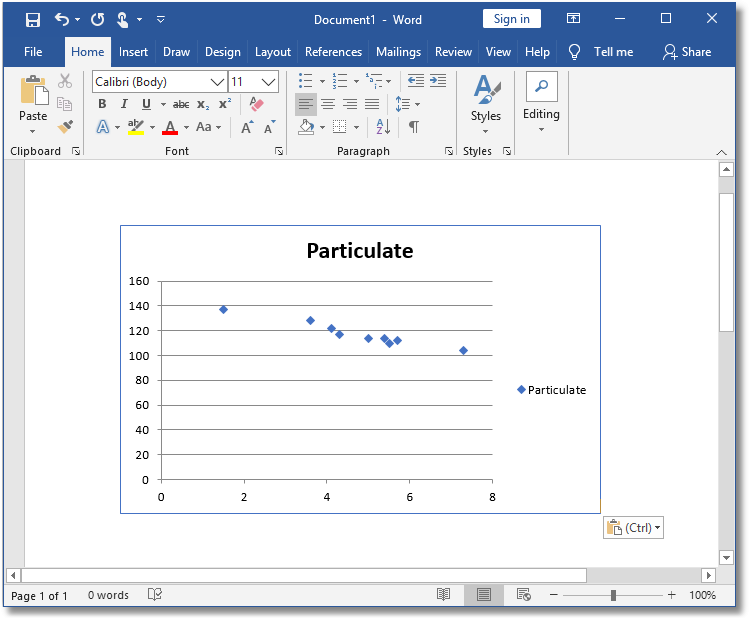
10. Copy the chart into an empty Microsoft Word document.
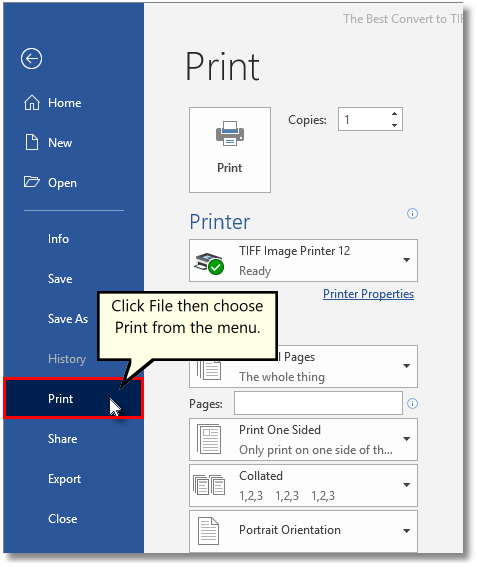
11. Click File-Print from the application menu.
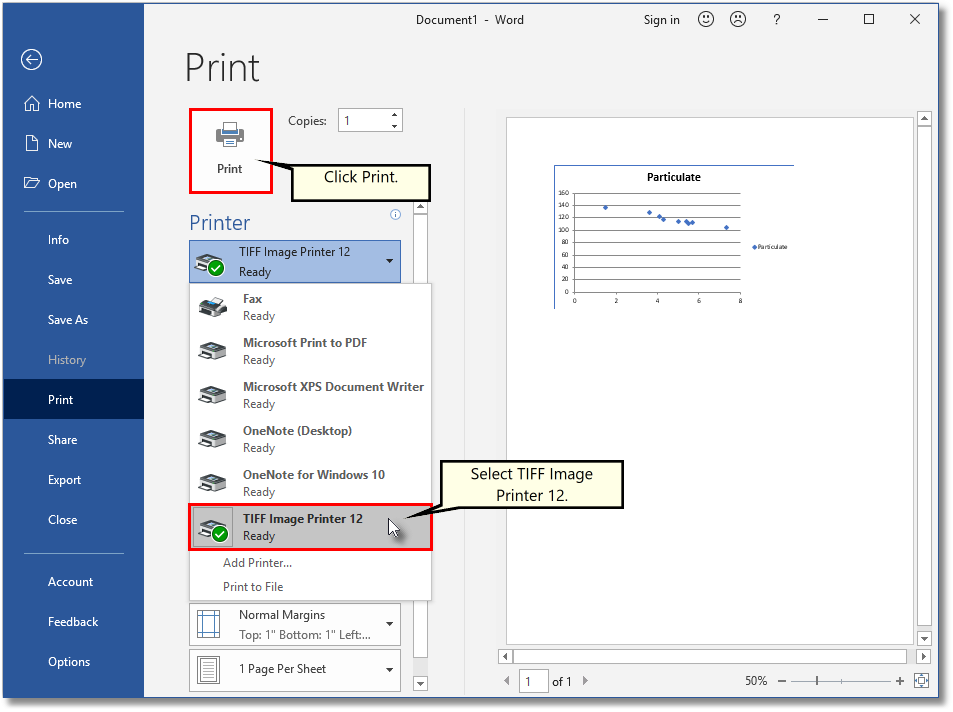
12. Choose TIFF Image Printer 12 from the list of printers and then click the Print button.
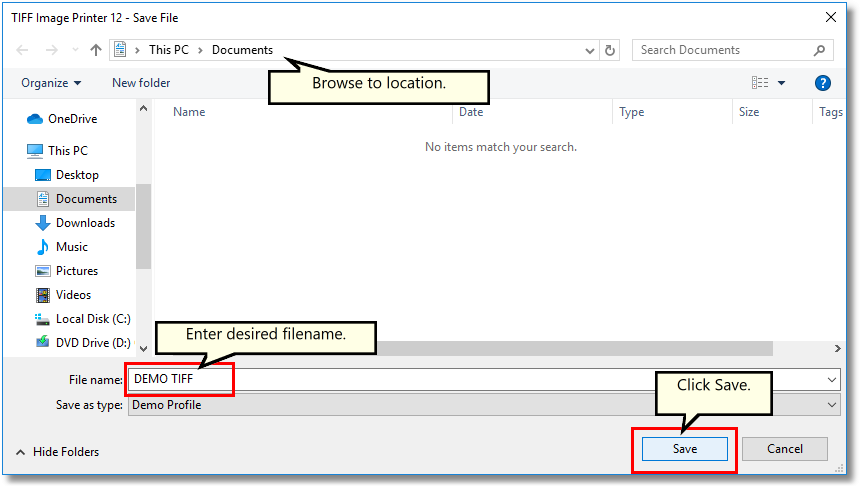
13. Enter the location and filename for the TIFF file and then click Save.
14. Now you have a TIFF image of your Excel chart.