The included logging console, the SmartInspect Redistributable Console, is used to monitor Document Conversion Service when it is running. It allows live logging that can be used to troubleshoot service start up issues and conversion errors should any occur.
When opened, the console will automatically start displaying any logging information coming from a running Document Conversion Service. All information being displayed is also saved to a rotating series of text files; see Viewing Saved Logs for more information.
|
Do Not Leave the SmartInspect Redistributable Console Open |
The SmartInspect Redistributable Console is meant for short term, live logging and troubleshooting access. Do not leave the logging console open for extended periods of time, such as overnight, or it will lock and cause issues with Document Conversion Service. |
|

How to Open the Logging Console
The logging console can be opened from the DCS Dashboard, the system tray icon or from the Start menu.
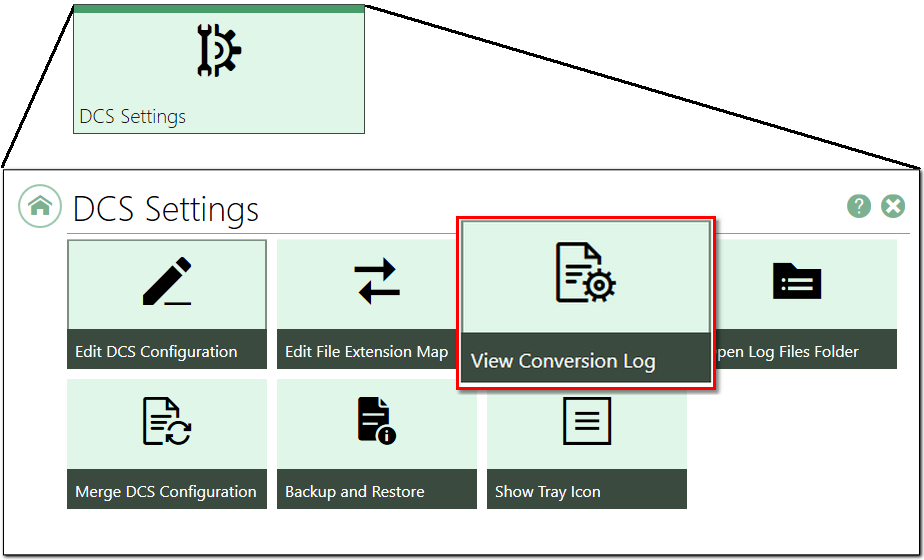
1.In the Document Conversion Service Dashboard, click the DCS Settings tile to open the panel with the DCS settings options. Click the View Conversion Log tile to open the logging console.
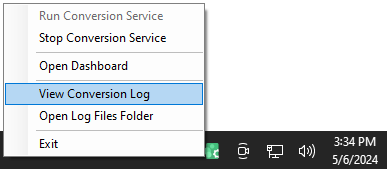
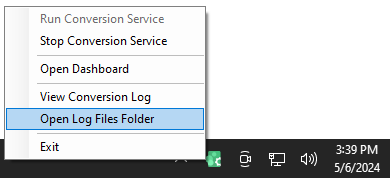
2.You can open the logging console from the system tray icon through the View Conversion Log menu item.
3.You can also open the logging console from Start - All Programs - PEERNET Document Conversion Service 3.0 - Open DCS Log Viewer.
Logging Console Main Window
The SmartInspect Redistributable Console main window consists of a view of the log entries and a toolbox section at the bottom which provide additional information.
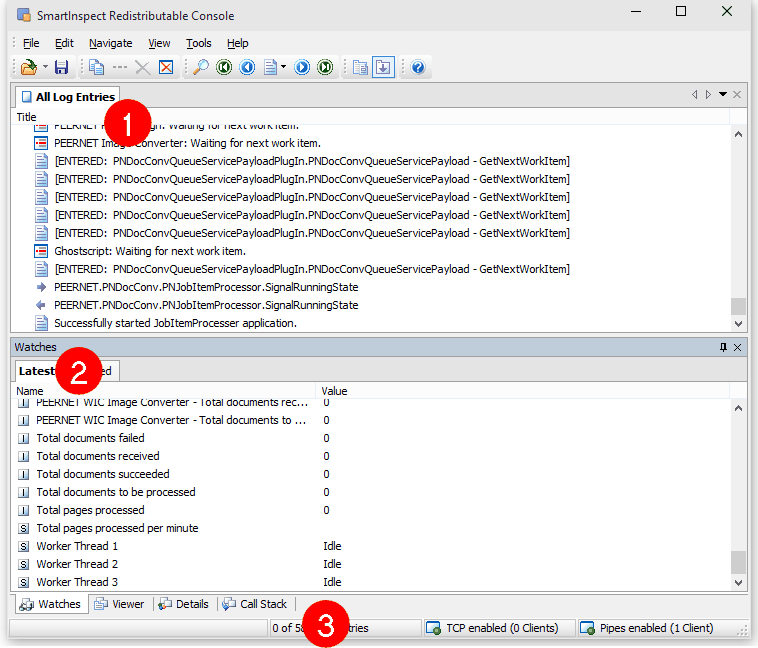
1.The All Log Entries view is the central part of the SmartInspect Redistributable Console main window and is responsible for displaying the individual logging entries as the service is running and processing files.
2.The Watches toolbox displays the state of the currently running threads, information on the total number of documents processed through the system and a collection of information about each converter that are running.
3.Other tabs available in the Watches section are:
a.Viewer - shows any attached data of the currently selected logging entry.
b.Details - shows the details of the log entry selected in the All Log Entries window.
c.Call Stack - show the call stack, if available, of the log entry selected in the All Log Entries window.
Filtering the Log Entries
You can filter the log entries so that you are only looking at entries that are reporting errors or warnings. There are many other ways to filter what is shown in the All Log Entries view; see the help file that is installed with SmartInspect Redistributable Console for more information.
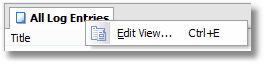
1.To apply a filter to the log entries, right-click the All Log Entries tab and select Edit View...
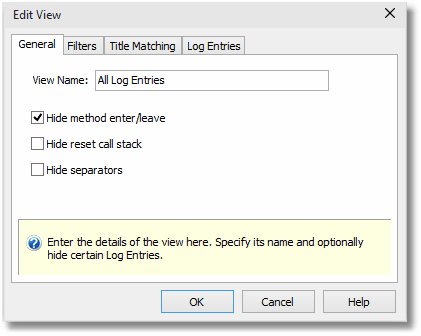
2.In the Edit View dialog, select the General tab then check the Hide method enter/leave option.
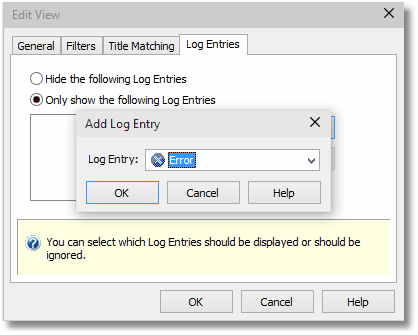
3.Select the Log Entries tab and then enable the Only show the following Log Entries option. Use the Add button to display the Add Log Entry dialog. Select the type of log entry you want to see and click OK to add it to the list.
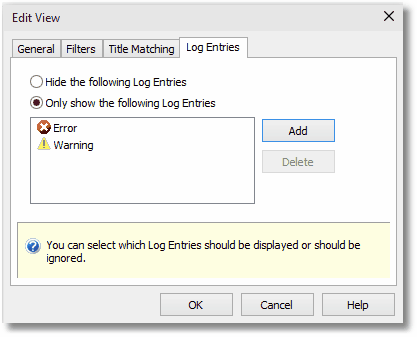
4.Repeat for all log entries (Error, Warning, etc.) that you want to see in the log entries view.
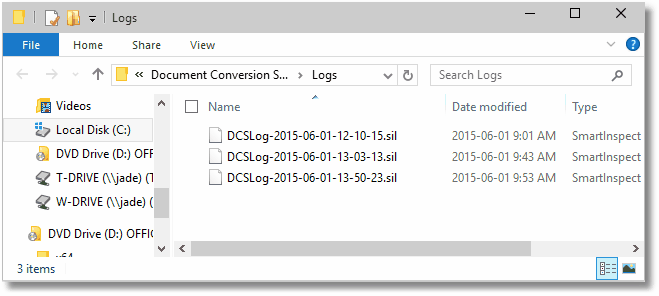
Viewing Saved Log Files
All logging information is also stored in a series of disk-based log files (up to 10 in total) that are rotated based on size and by day.
1.From the system tray icon select Open Log Files Folder.
2.The log files all start with the name DCSLog followed by date and time. Double-click any of these files to view that log in the logging console.